Note
Click here to download the full example code
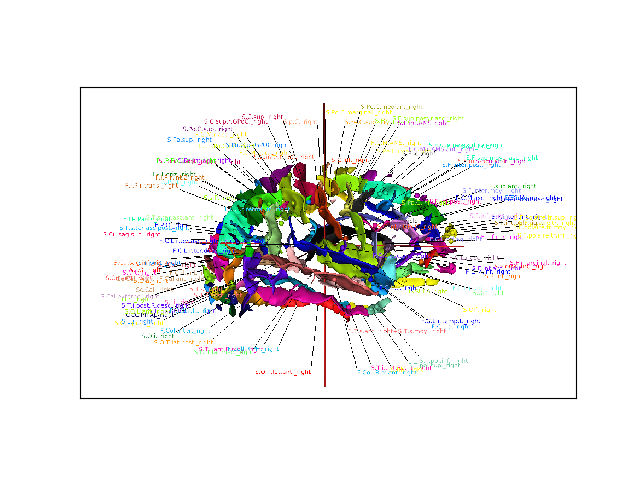
3D Text annotations on a graph
Display graph labels as 3D text annotations. This code is somewhat equivalent to what happens using the ‘A’ key in selection control mode (actually this is an ancestor of the module which has been incorporated in Anatomist).
from __future__ import print_function

from __future__ import absolute_import
import anatomist.direct.api as ana
from soma import aims
import os
import numpy
import sys
from soma.qt_gui.qt_backend import QtGui
import six

byvertex = False


class Props(object):

    def __init__(self):
        self.lvert = []
        self.lpoly = []
        self.usespheres = True
        self.colorlabels = True
        self.center = aims.Point3df()


def makelabel(label, gc, pos, color, props):
    objects = []
    to = ana.cpp.TextObject(label)
    to.setScale(0.1)
    to.setName('label: ' + label)
    a.registerObject(to, False)
    a.releaseObject(to)
    if label in colors:
        color = colors[label]
    if props.usespheres:
        sph = aims.SurfaceGenerator.icosphere(gc, 2, 50)
        asph = a.toAObject(sph)
        asph.setMaterial(diffuse=color)
        asph.setName('gc: ' + label)
        a.unregisterObject(asph)
        a.registerObject(asph, False)
        a.releaseObject(asph)
        objects.append(asph)
    if props.colorlabels:
        to.GetMaterial().set({'diffuse': color})
    texto = ana.cpp.TransformedObject([to], False, True, pos)
    texto.setDynamicOffsetFromPoint(props.center)
    texto.setName('annot: ' + label)
    objects.append(texto)
    props.lpoly.append(aims.AimsVector_U32_2((len(props.lvert),
                                              len(props.lvert) + 1)))
    props.lvert += [gc, pos]
    a.registerObject(texto, False)
    a.releaseObject(texto)
    return objects


runloop = False
if QtGui.QApplication.startingUp():
    runloop = True

a = ana.Anatomist()
qapp = QtGui.QApplication.instance()
share = aims.carto.Paths.globalShared()
nomenclname = os.path.join(aims.carto.Paths.shfjShared(), 'nomenclature',
                           'hierarchy', 'sulcal_root_colors.hie')
graphname = os.path.join(share, 'doc', 'pyanatomist-' + '.'.join(
    [str(x) for x in aims.version()]), 'examples', 'Rbase.arg')
labelatt = 'name'

nomenclature = a.loadObject(nomenclname)
graph = aims.read(graphname)
if 'label_property' in graph:
    labelatt = graph['label_property']
agraph = a.toAObject(graph)
agraph.releaseAppRef()
w = a.createWindow('3D')
w.addObjects(agraph, add_graph_nodes=True)
# lgraphaims = aims.Graph( 'labelsGraph' )
# lgraph = a.toAObject( lgraphaims )

bbox = agraph.boundingbox()
bbox = (aims.Point3df(bbox[0][:3]), aims.Point3df(bbox[1][:3]))
props = Props()
props.center = (bbox[0] + bbox[1]) / 2

size = (bbox[1] - bbox[0]).norm() * 0.2
vs = graph['voxel_size'][:3]
objects = []
lines = aims.TimeSurface(2)


elements = {}
colors = {}

for v in graph.vertices():
    if 'gravity_center' in v and labelatt in v:
        gc = aims.Point3df(numpy.array(v['gravity_center']) * vs)
        label = v[labelatt]
        if label != 'unknown':
            if label not in elements:
                elem = [aims.Point3df(0, 0, 0), 0.]
                elements[label] = elem
            else:
                elem = elements[label]
            sz = v['size']
            elem[0] += gc * sz
            elem[1] += sz
            color = [0, 0, 0, 1]
            if 'ana_object' in v:
                av = v['ana_object']
                color = av.GetMaterial().genericDescription()['diffuse']
                colors[label] = color
            if byvertex:
                pos = gc + (gc - props.center).normalize() * size
                objects += makelabel(label, gc, pos, color, props)


if not byvertex:
    for label, elem in six.iteritems(elements):
        gc = elem[0] / elem[1]
        pos = gc + (gc - props.center).normalize() * size
        if label in colors:
            color = colors[label]
        else:
            color = [0, 0, 0, 1]
        objects += makelabel(label, gc, pos, color, props)

lines.vertex().assign(props.lvert)
lines.polygon().assign(props.lpoly)
alines = a.toAObject(lines)
a.unregisterObject(alines)
a.registerObject(alines, False)
a.releaseObject(alines)
del lines
alines.setMaterial(diffuse=[0, 0, 0, 1])
objects.append(alines)
del alines
labels = a.groupObjects(objects)
labels.releaseAppRef()
w.addObjects(labels, add_children=True)

if 'sphinx_gallery' in sys.modules:
    w.windowConfig(view_size=[907, 568])
    w.camera(view_quaternion=[0.520213842391968,
                              -0.42516353726387,
                              -0.470633894205093,
                              0.571941733360291],
             zoom=0.8187)
    # display in matplotlib for sphinx_gallery
    w.sphinx_gallery_snapshot()
    runloop = False

if runloop:
    qapp.exec_()

if runloop or 'sphinx_gallery' in sys.modules:
    del w, nomenclature, agraph, graph, objects, labels, elements, colors
Total running time of the script: ( 0 minutes 9.187 seconds)
