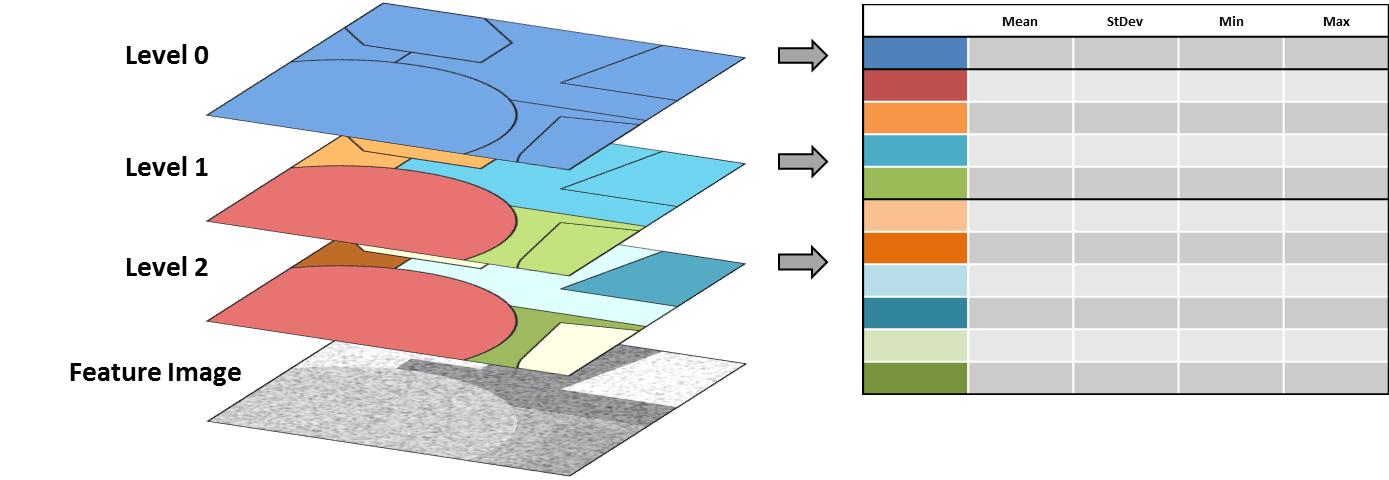
This process aims at extracting volume measures and descriptive statistics from quantitative images and/or atlases. Feature images can be 2, 3 or 4 dimensional and supervising ROIs can be graphs, volume of labels (2D/3D) or probability maps (4D).
If a hierarchy is provided, the analysis is performed, in a hierarchical fashion, for each node of the hierarchy. This hierarchy can be lateralized (with a different label for left and right strucutres), or a lateralization mask (Input_ListOf_Side) can be provided. In both cases, full, left and right statistics can be computed. Else, only full statistics are computed.
Each input can receive single entries or lists. If several inputs are provided with lists, they must be the same size. Single entries are used for all the entries of list inputs.
The process shows on the standard output a table compiling the results. This table can be saved as a CSV file if Output_CSV_File is filled.
Input_ListOf_Volume: ListOf( 4D Volume ) ( optional, input )Volume of features for which descriptive statistics must be computed. Available statistics are mean, minimum, and maximum values as well as standard deviation. If a ROI volume is provided, theses statistics are computed in each region (each node of a hierarchy is also provided).
If the volume is 4-dimensional, statistics are computed at each time step and for the aggregation of all time steps.
If no volume of features is provided, only volume measurements computed from the ROI volume are computed.
Input_ListOf_ROI: ListOf( 4D Volume ) ( input )Volumes of labels or graph volumes (.arg). If volumes of features are provided, ROI volumes are resampled in their resolution before any computation (of statistics or volumes) is performed. Volume measures might thus differ from those obtained with AimsRoiFeatures.
Input_ListOf_Side: ListOf( 3D Volume ) ( optional, input )Volumes of side labels allow to lateralize ROIs when labels are not natively different for the left and right hemispheres. They should contain two labels :
- 1 for the right hemisphere ;
- 2 for the left hemisphere.
Input_ListOf_Hierarchy: ListOf( Hierarchy ) ( optional, input )Hierarchy corresponding to the ROI volume. Its use allows :
- to automatically name regions in the result table ;
- to provide left/right association to lateralization labels when they are embedded in the ROI volume ;
- to perform a hierarchical analysis.
Input_ListOf_Motion: ListOf( Transformation matrix ) ( optional, input )Affine motions transforming ROI volumes towards feature volumes (or the opposite).
Motion_Direction: Choice ( optional, input )Direction of the provided motions.
Automatic_Names: Boolean ( optional, input )This option only works if the input images are stored in a BrainVISA database. If true, volumes are automatically named in the result table based on their attributes : [subject]_[acquistion]_[analysis]
Volume_Names: ListOf( String ) ( optional, input )Manually name volumes for the result table. If no names are provided, filenames are used.
Full: Boolean ( optional, input )Compute full brain statistics (left and right hemispheres are merged).
Left: Boolean ( optional, input )Compute left hemisphere statistics.
Right: Boolean ( optional, input )Compute right hemisphere statistics.
Volume: Boolean ( optional, input )Perform volume measurements. If ROIs are probability maps, measures take into account partial volume.
Mean: Boolean ( optional, input )Compute the mean feature value in each ROI. If the ROI is a probability maps, observations are weighted accordingly.
StDev: Boolean ( optional, input )Compute the standard deviation of the feature values in each ROI. If the ROI is a probability maps, observations are weighted accordingly.
Min: Boolean ( optional, input )Compute the minimum feature value in each ROI.
Max: Boolean ( optional, input )Compute the maximum feature value in each ROI.
Output_CSV_File: CSV file ( optional, output )Store the result in a CSV file.
Toolbox : Primatologist
User level : 0
Identifier :
HierarchicalRoiAnalysisFile name :
brainvisa/toolboxes/primatologist/processes/analysis/HierarchicalRoiAnalysis.pySupported file formats :
Input_ListOf_Volume :gz compressed NIFTI-1 image, Aperio svs, BMP image, DICOM image, Directory, ECAT i image, ECAT v image, FDF image, FreesurferMGH, FreesurferMGZ, GIF image, GIS image, Hamamatsu ndpi, Hamamatsu vms, Hamamatsu vmu, JPEG image, Leica scn, MINC image, NIFTI-1 image, PBM image, PGM image, PNG image, PPM image, SPM image, Sakura svslide, TIFF image, TIFF image, TIFF(.tif) image, TIFF(.tif) image, VIDA image, Ventana bif, XBM image, XPM image, Zeiss czi, gz compressed MINC image, gz compressed NIFTI-1 imageInput_ListOf_ROI :Graph and data, BMP image, Directory, ECAT i image, ECAT v image, FDF image, FreesurferMGH, FreesurferMGZ, GIF image, GIS image, Graph and data, JPEG image, MINC image, NIFTI-1 image, PBM image, PGM image, PNG image, PPM image, SPM image, TIFF image, TIFF(.tif) image, VIDA image, XBM image, XPM image, Z compressed ECAT i image, Z compressed ECAT v image, Z compressed GIS image, Z compressed SPM image, Z compressed VIDA image, gz compressed ECAT i image, gz compressed ECAT v image, gz compressed GIS image, gz compressed MINC image, gz compressed NIFTI-1 image, gz compressed SPM image, gz compressed VIDA imageInput_ListOf_Side :gz compressed NIFTI-1 image, Aperio svs, BMP image, DICOM image, Directory, ECAT i image, ECAT v image, FDF image, FreesurferMGH, FreesurferMGZ, GIF image, GIS image, Hamamatsu ndpi, Hamamatsu vms, Hamamatsu vmu, JPEG image, Leica scn, MINC image, NIFTI-1 image, PBM image, PGM image, PNG image, PPM image, SPM image, Sakura svslide, TIFF image, TIFF image, TIFF(.tif) image, TIFF(.tif) image, VIDA image, Ventana bif, XBM image, XPM image, Zeiss czi, gz compressed MINC image, gz compressed NIFTI-1 imageInput_ListOf_Hierarchy :Hierarchy, HierarchyInput_ListOf_Motion :Transformation matrix, Transformation matrixOutput_CSV_File :CSV file, CSV file