Automatic statistical analysis for 123I-FP-CIT images.
Description
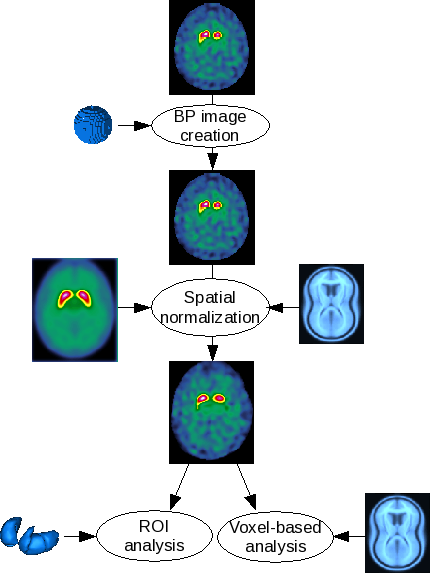
The DaTSCAN pipeline allows a user to normalize 123I-FP-CIT images to a 123I-FP-CIT template and then to automatically analyze the normalized image.
Method
123I-FP-CIT template specifications
The 123I-FP-CIT template has been built from normal scans of 10 subjects with essential tremor (mean age +/- SD = 64.4 +/- 12.5 y).
They were acquired on a two-head gamma-camera (AXIS, Philips) equipped with LE-HR parallels collimators (120 projections over 360 degrees 128x128 matrix). Projections were reconstructed using the OSEM algorithm on a Odyssey station. The reconstructed volume was filtered using a Butterworth filter (order, 4 ; cutoff frequency, 0.35 cycle/pixel) and then corrected for attenuation. Native images were transformed in BP parametric images and then put into the MNI referential through SPM2. The normalized parametric images were symmetrized. The final template is the smoothed mean image of the 20 parametric 123I-FP-CIT images (gaussian filter, FWHM = 8mm).
Binding potential (BP) parametric image
ROI
This step is the 123I-FP-CIT non-specific uptake measure with a spherical ROI, usually put on the occipital cortex at the axial slices containing the maximum striatal activity.
Parametric image creation
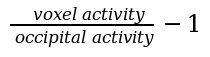
The parametric image is obtained by dividing each voxel intensity by the mean occipital activity, using the following formula:
Spatial normalization
Estimation
The template allows to put the images in the Montreal Neurological Institute (MNI, http://www.bic.mni.mcgill.ca) without recourse to an anatomical image. Since the 123I-FP-CIT template has been built from parametric images of binding potentials, the images to be analyzed must be parametric : the previous step is mandatory.
The spatial normalization is done by SPM8 or SPM12 (http://www.fil.ion.ucl.ac.uk/spm/software/spm8) with the SPM default settings.
Statistical analysis
ROI
Due to manually segmented striatum ROI (right and left caudate nucleus ; right and left putamen), the following values are computed for each structure: mean BP ; ratios (right/left, caudate/putamen, ...) ; z-scores using a control group.
Voxel-based
A second level analysis (two sample t-test) is computed: one subject versus a control group. The user has access to the following option: the threshold masking type and value ; the use of an implicit mask and/or an explicit mask. The subject (current subject and controls) ages are automatically used as a covariable.
User interactions
Data import and conversion
The user could import the DICOM images by clicking on this icon:  . Once an image selected, it is automatically converted in NIfTI format and then inserted in the database.
Non-specific activity ROI
A window will show the native image. The user is prompted to set the size of the sphere and then to click on the image to define the center of the sphere.
Spatial normalization verification
After the spatial normalisation estimation, the user is advised to check the result : a window shows the normalized image, the template and a segmentation of the striatum of the two images (each object is shown in the three directions : axial, coronal and sagittal).
Statistical analysis verification
For both analysis types, a window will show the subject and control group information and the statistical results. It will also show some visualization:
- ROI: an axial view with the normalized image and the striatum ROI
- voxel-based: three views (axial, coronal and sagittal) with the t-map blended with the MNI single subject MRI and the glass-brain