Estimate clique statistics from a "ground truth" volume of labels.
Within an image of labels, a clique is a couple of adjacent labels. This process computes statistics on cliques distribution from an image considered to be ground truth. Here, cliques are not considered in terms of absolute (the probability of finding the combination (i,j) in the image) but in conditional terms (the probability for a voxel to be labeled i if one of its neighbours is labeled j).
In practice, "absolute" statistics are first stored into a symmetric matrix, which is then normalized along the first axis, making it non-symmetric in the end.
Description
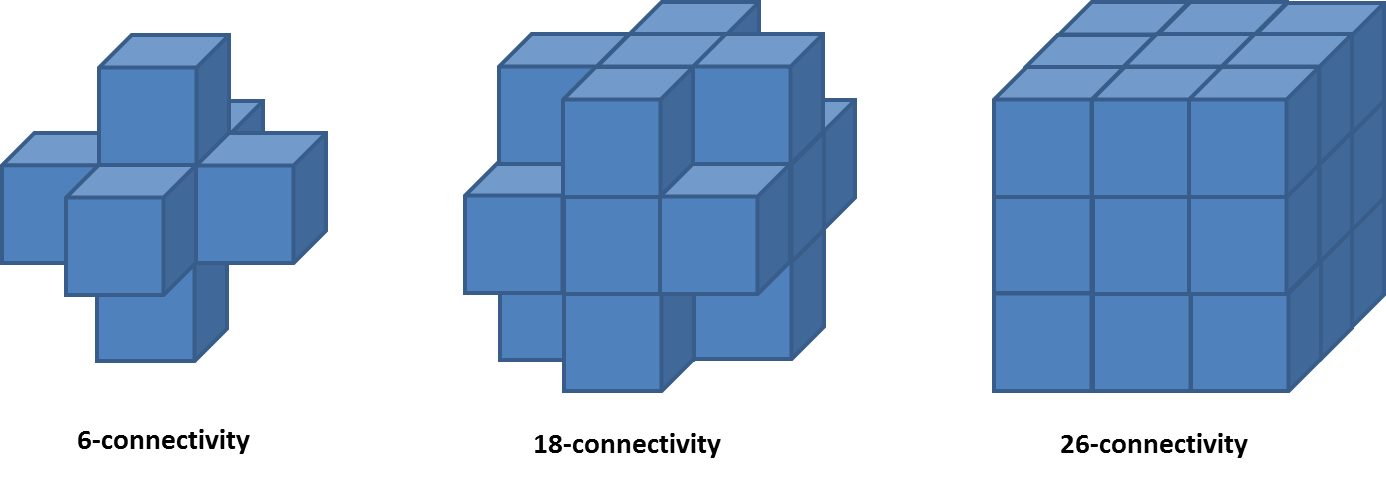
A connectivity describes which neighbours configuration are considered a clique (Figure 1).
Figure 1. Voxels considered neighbours of a given central voxel under different connectivities. A clique is a set of two voxels that are neighbours under a chosen connectivity.
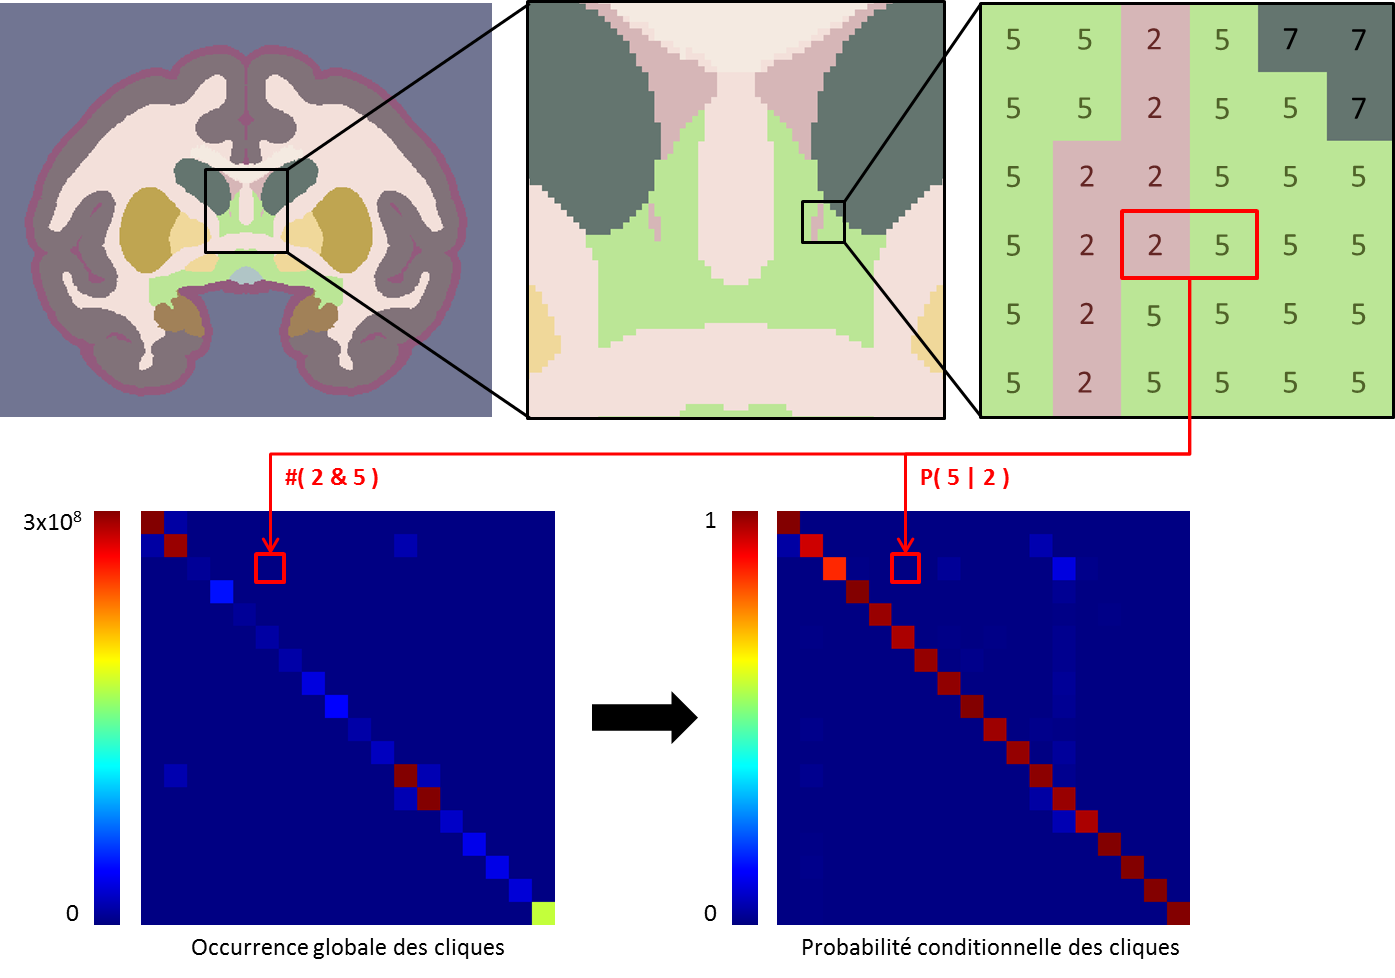
Statistics are then computed on all cliques in the image. All cliques are equally weighted, whether the input volume is isotropic or not, and whether the clique is a face, edge or corner clique. The resulting matrix is symmetric as shown Figure 2. The matrix is then normalized along the x direction to obtain conditional cliques probabilities.
Figure 2. Construction of the cliques conditional probabilities matrix.
Implementation
This process is implemented in Python. It is thus rather innefficient, despite the use of numpy routines and efforts to minimize loops. Its non-frequent use (only once when creating an atlas usable with our pipeline) makes this issue of low priority for now.
Path to the output matrix file. It will be stored as a 2D image with
voxel (i,j) containing the probability for a voxel to have the
label i if one neighbour has the label j.
Output_Type: Choice ( input )
Data type in which statistics should be computed and stored.
Double has more precision but also requires more memory.