BrainRAT Handbook
| Last update: | 2008/11/11 |
|---|
Description of BrainRAT
Documentation
You can find the documentation of the toolbox on brainvisa web site.
Contributors
BrainRAT results from collaborative work of image processing methodologists and biologists of MIRCen, a new CEA facility headed by Philippe Hantraye and dedicated to preclinical research.
BrainRAT is mainly developed by the MIRCen image processing team of Thierry Delzescaux, PhD (Julien Dauguet, PhD, Jessica Lebenberg, PhD student, N. Souedet, software engineer and Didier Thenadey, IT specialist) as well as by some close collaborators (Albertine Dubois, PhD, Inserm U803, Vincent Frouin, CEA/SCSR, Denis Rivière, PhD and Yann Cointepas, PhD, CEA/NeuroSpin).
Expert biologists have been associated with this project, from the beginning, to guarantee the relevance of developed methods and the compatibility/performances of processing times with biological experiments (Anne-Sophie Hérard, PhD, Gilles Bonvento, PhD, and Françoise Condé, PhD).
All the above-mentioned people can be contacted by e-mail at brainrat@cea.fr.
Objectives
BrainRAT’s goal is to provide an automated and generic toolbox for the processing of histological and autoradiographic sections based on a two-step approach, which involves:
- an optimized digitization including an automated individualization, section number assignment, stacking, and dealing with hundreds of autoradiographic and histological sections (series of individual sections as well as multiple sections digitized in a single acquisition).
- a robust reconstruction algorithm of the volumes based on a reliable registration method (block-matching) enabling 3D reconstruction of a single volume from a series of slices as well as the co-alignment of slices with a reference volume.
History
At the beginning, these methods have been developed to analyse autoradiographic data in 3D using complementary histological information. The 3D reconstruction of biological volumes arising from several histological and/or autoradiographic sections enables to take advantage of the high resolution of ex vivo autoradiography as well as of the diversity of available histological stainings.
The analysis of autoradiographic data, 3D reconstructed or not, remains traditionally limited to conventional region of interest (ROI)-based analysis. Although the users have the corresponding histological stained sections available to consider anatomical information, the delineation of ROI(s) to be analyzed is usually directly performed on the autoradiographic sections, which may be inaccurate and subject to observer bias. To overcome this limitation, BrainRAT enables to perform multimodal co-registration between slices or 3D reconstructed volumes.
Recent studies have highlighted the ability of voxel-wise statistical analysis to deal with 3D reconstructed autoradiographic volumes for group comparisons. This automated, exploratory, whole-brain approach can be used to analyze local functional differences between population groups without the need for prior assumptions. BrainRAT provides useful tools to carry out such studies in optimal conditions (optimized digitization, 3D reconstruction algorithms, activity conversion and intensity normalization procedures).
These methods have been applied to Nissl stained (cresyl violet) sections and [<superscript>14</superscript>C]-2DG autoradiography, and intensively validated both in rat and mouse brain. They have been also successfully tested on other post mortem imaging modalities such as immunohistochemistry, fluorescence, etc. They could now be extended to various biological applications (activation models, morphology, lesion extension, development, etc.) and to domains of application including pathological and therapeutic studies involving animal models of various brain diseases (neurodegenerative diseases, ischemia, and cancer).
References
For the time being, the only reference to BrainRAT is related to proceedings of the SFN 2008:
BrainRAT: Brain Reconstruction and Analysis Toolbox. A freely available toolbox for the 3D reconstruction of anatomo-functional brain sections in rodents. A. Dubois, J. Dauguet, N. Souedet, A.-S. Hérard, D. Rivière, Y. Cointepas, G. Bonvento, P. Hantraye, V. Frouin, T. Delzescaux. In Proc. 38th annual meeting of the Society for Neuroscience, Washington, USA, 2008.
The main reference relating to the computerized treatments and procedures gathered in BrainRAT to be mentioned is:
Automated three-dimensional analysis of histological and autoradiographic rat brain sections: application to an activation study. A. Dubois, J. Dauguet, A-S. Hérard, L. Besret, E. Duchesnay, V. Frouin, P. Hantraye, G. Bonvento and T. Delzescaux. Journal of Cerebral Blood Flow and Metabolism, 2007, 27(10), 1742-1755. Abstract.
Yet, these developments were the basis of other works published by our team:
They enabled to provide evidence that the metabolic response to synaptic activation (i.e. glucose uptake) is decreased in the superior colliculus during visual stimulation in young adult mice deficient for the glial glutamate transporter GLT-1 (Fig. 1).
Decreased metabolic response to visual stimulation in the superior colliculus of mice lacking the glial glutamate transporter GLT-1. A-S. Hérard, A. Dubois, C. Escartin, K. Tanaka, T. Delzescaux, P. Hantraye and G.Bonvento. European Journal of Neuroscience, 2005, 22(7):1807-11. Abstract.
They enabled to accurately study stimulus-driven synaptic activity in vivo in a restricted rat brain region, the superior colliculus (Fig. 2).
siRNA targeted against amyloid precursor protein impairs synaptic activity in vivo. A-S. Hérard, L. Besret, A. Dubois, J. Dauguet, T. Delzescaux, P. Hantraye, G. Bonvento and K.L. Moya. Neurobiology of Aging, 2006, 27(12):1740-50. Abstract.
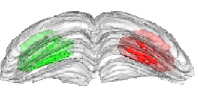
Fig. 2: 3-D reconstruction of the left and right manually segmented superior colliculus. The automatic extraction of the “activated” volume using the threshold method is represented in red and the symmetric volume in green.
They also enabled the investigation of new methods of analysis of 3D biologic data in groups of rodents, based on voxel-wise statistical approaches without the need for prior assumptions (Fig. 3).
Quantitative validation of voxel-wise statistical analyses of autoradiographic rat brain volumes: application to unilateral visual stimulation. A. Dubois, A-S. Hérard, E. Duchesnay, G. Flandin, L. Besret, P. Hantraye, G. Bonvento and T. Delzescaux. NeuroImage, 2008, 40(2), 482-494. Abstract.
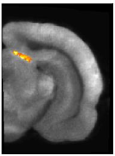

Fig. 3: Brain area (the superior colliculus) in which CMRGlu was significantly higher or lower in visually stimulated hemibrains than in the corresponding control hemibrains automatically detected by a voxel-wise statistical analysis. Significance is indicated with t statistic color scales, corresponding to the level of significance at voxel level.
Lastly, these developments were also the basis of works performed in collaboration with other teams:
Metabolic and vascular changes induced in mice olfactory glomeruli by odor presentation (Fig. 4). Gurden et al. IMNC, UMR8165 CNRS-University of Paris 7 and Paris 11, Orsay, France. 5th Forum of European Neuroscience (FENS), Vienna, Austria, 2006.
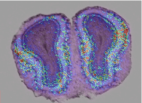
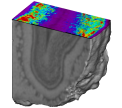
Fig. 4: Anatomo-functional superimposition and 3D reconstruction of the olfactory bulb.
The potential of the radiosensitive β-microprobe to monitor the [18F]-MPPF binding in the mouse hippocampus in vivo (Fig. 5). Desbrée et al. IMNC, UMR8165 CNRS-University of Paris 7 and Paris 11, Orsay, France. Journal of Nuclear Medicine, 2008, 49(7):1155-61. Abstract.
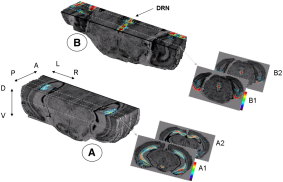
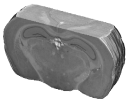
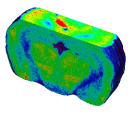
Fig. 5: 3D postmortem imaging of radioligand distribution in mouse brain after injection of [18F]-MPPF. Background black and white anatomic volumetric reconstruction of cresyl violet-stained sections shows bilateral location of 5-HT1A binding in mouse hippocampus. Pseudocolored digitized autoradiographs illustrate level of [18F]-MPPF binding and are color-coded from low (blue) to high (red) binding.
Ongoing work
The next releases of BrainRAT toolbox will contain new processes allowing to:
- Speed up of registration processes (optimization, parallelization);
- Use blockface images (photographs of the brain face taken during the sectioning process) as a consistent 3D geometric reference for reconstruction of post mortem volumes;
- Bring in vivo data such as MR images into registration with 3D reconstructed post mortem volumes;
- Use a MRI-based 3D digital atlas as a template for fully-automated brain structure segmentation of in vivo and post mortem data;
- Configure dedicated databases by defining a reliable organization description (ontology).
BrainVISA/Anatomist
BrainRAT toolbox is a BrainVISA add-on module package providing additional processes and functionalities relating to 3D reconstruction and analysis of post mortem rodent brain sections.
BrainVISA, in-house image processing software, is already available for free download on the Internet (http://brainvisa.info). Since then, the core of BrainVISA is mainly developed in CEA/NeuroSpin by the LNAO lead by Jean-François Mangin, PhD (Yann Cointepas, PhD and D. Rivière, PhD) and by software engineers of the IFR 49 (Isabelle Denghien and Dominique Geffroy). The first prototype was developed by Yann Cointepas during years 2000/2001. BrainVISA also relies on Anatomist software visualization capacities.
Anatomist has been designed in the Service Hospitalier Frederic Joliot of CEA and is now mainly developed by Denis Rivière, PhD. The current version stems from ten years of work on several prototypes. One of its main original features is the generic module dedicated to structural data, namely sets of objects linked one another into a graph structure. It also provides a toolbox for ROI manual drawing.
General support
If you have any problems or queries relating to BrainRAT, BrainVISA or Anatomist, please contact us through the BrainVISA forum at: http://brainvisa.info/forum.
Yet, before asking questions of reporting problems, please make sure your query is not solved in the FAQ. Thank you to consider that we have very few resources for technical support at the moment.
If you have any problems with your data, please check the procedure described in the How to scan section.
Demonstration data
Important
For training and educational purposes, 2 datasets can be downloaded on demand at the following e-mail address: brainrat@cea.fr. Please mention your institution, lab, research area, email address and operating system (Windows, MacOS or Linux).
Demonstration data enable to test all the BrainRAT functionalities through two applications:
- A unilateral stimulation of the rat visual system ([14C]-2DG autoradiography, Nissl staining -> ~150 adjacent sections)
- A whole rat brain anatomical dataset(Nissl staining -> ~200 adjacent sections)
Demonstration data will be made available electronically via anonymous FTP from the CEA FTP server as .zip or .tar.gz files according to our operating systems.
Remember that they are CEA property and are made available for educational purposes only. The use of these data for other purposes are submitted to CEA authorization. In case of use of BrainRAT for academic researches, please mention Dubois et al., 2007, J. Cereb. Blood Flow Metab.
BrainRAT process categories
01. post mortem rebuilt 2D <=> 3D
Description
- post mortem rebuilt 2D <=> 3D allows the 3D reconstruction of biological volumes arising from several histological and/or autoradiographic sections, beforehand individually digitized or acquired as overall scans (see How to scan).
02. post mortem imaging analysis
Description
- post mortem imaging analysis allows the conversion of grey level values in 3D reconstructed [14C]-2DG autoradiographic volumes to activity (nCi/g) or CMRGlu (µmol/100g/min) values. A module enabling to perform a conventional ROI-based analysis of these volumes is also proposed.
03. toolbox
Description
- toolbox contains plugged-in modules allowing basic image processing operations such as deletion, permutation or replacement of damaged sections, flip of a slice/volume either in a mirror way or swapping coordinates, etc.
Processes
- volume - file conversion
- volume - axial interleaved volume extraction
- volume - axial slice deletion
- volume - axial slice replacement
- volume - axial slices permutation
- volume - flip application
- volume - flip application on a slice
- volume - intensity normalization
- volume - interactive subvolume extraction
- image - rename image series
- volume - subvolume stacking
BrainRAT best practice
Quality check
After running one of the processes of BrainRAT process categories, you will be able to view the output files and assess the quality of the registrations and 3D reconstruction procedures in different orthogonal incidences by clicking on the  icon in Output_3dImage and visualizing volumes in Anatomist (Fig. 6 and Fig. 7.
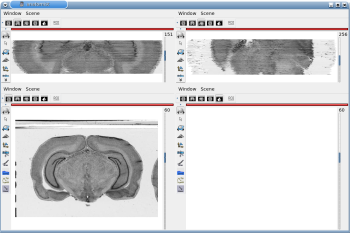
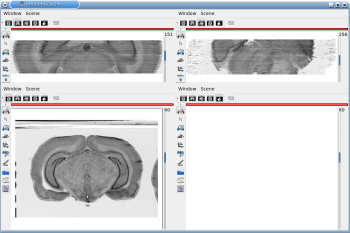
Fig. 6: 3D reconstruction of histological volume (Nissl stain) encompassing a large part of the visual system (between bregma -5.2 mm and bregma -8.2 mm), in coronal, axial and sagittal views before (top) and after registration (bottom).
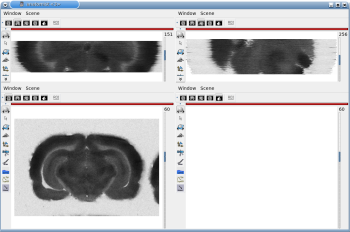
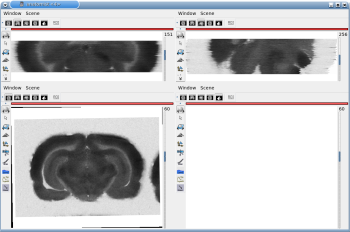
Fig. 7: 3D reconstruction of [14C]-2DG autoradiographic volume, encompassing a large part of the visual system (between bregma -5.2 mm and bregma -8.2 mm), in coronal, axial and sagittal views before (top) and after registration (bottom).
How To Scan : Optimized high throughput digitization procedure of autoradiographic and histological sections
Generality
Autoradiographs, corresponding histological section sets and radioactive [14C] standards are digitized with a flatbed scanner in transmission mode as either 8-bit or 16-bit grey-scale images (according to your scanner model).
In-plane digitization resolution needs to be sufficiently high to reveal the main structures of interest in the brain. Usually we choose a 600 dpi resolution (pixel size 42x42 µm2), for rat brain and a 1200 dpi resolution (pixel size 21x21 µm2), for the mouse one.
The calibration scale available with the scanner gives the relation between optical density and gray level values in the autoradiographic images. As gray level calibration is critical for quantitative autoradiography analysis, make sure to use appropriate software for acquiring your images.
Section arrangement on glass slides
A prerequisite for using BrainRAT process 02. image - individualizing and stacking multiple slices is that brain sections have been rigorously mounted on glass slides.
All the slice arrangements on glass slides are conceivable (Fig. 8 and Fig. 9).
Yet, the following condition shall be respected as far as possible:
ONLY ONE arrangement for the whole dataset
The slice arrangements chosen by operator during the sectioning process will be requested as parameter values when using process 02. image - individualizing and stacking multiple slices.
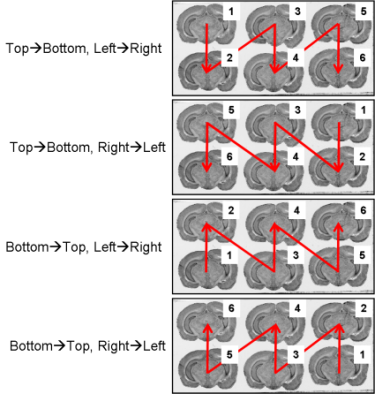
Fig. 8: All possible section arrangements on glass slides according to column first, which are managed by BrainRAT process 02. image - individualizing and stacking multiple slices.
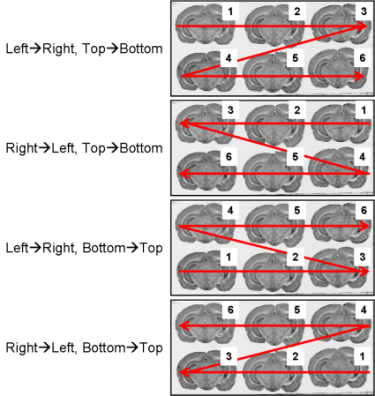
fig. 9: All possible section arrangements on glass slides according to line first, which are managed by BrainRAT process 02. image - individualizing and stacking multiple slices.
The section arrangements chosen by operator during the sectioning process will be requested as parameter values when using process 02. image - individualizing and stacking multiple slices.
If for any reason you have not been able to respect this condition, an alternative is possible. Process each overall scan independently and then use process volume - subvolume stacking (03. toolbox) to concatenate the intermediate volumes (along Z-axis). Yet, make sure the volumes have all the same horizontal and vertical dimensions.
Number of sections per glass slide can vary: from 10-8 for small sections (olfactory bulb and frontal brain) to 6-4 for larger ones (midbrain and cerebellum). However, another condition shall be respected: acquiring and storing column images that have the same number of sections per glass slide.
Note
- Though an automated analysis of width and height parameters for each section according to median values have been implemented to detect and to correct for vertical and horizontal overlaps between two sections, try to let enough space between each line and each column to limit such a phenomenom (Fig. 10).
b.
Fig. 10: Vertical (a) and horizontal (b) overlaps between two histological sections.
- High-quality sections are essential to make the corresponding volumes spatially consistent in 3D. Indeed, the block-matching registration technique is based on both the section edges and the whole image, so the result of the 3D reconstruction will strongly depend on the information available in the sections to be processed, that is to say, on the quality of data.
Glass slide arrangement on the surface of the scanner
Another prerequisite for using BrainRAT process 02. image - individualizing and stacking multiple slices is that the autoradiographic and histological sections have been acquired and stored under the form of glass slide column images called “overall scans” and whose size has been given by the scanner’s field of view.
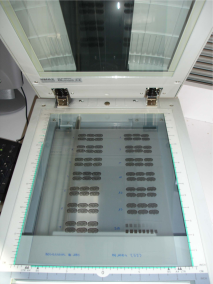
After the sectioning process, brain sections were exposed for several days to an autoradiographic film by arranging glass slides one below the other. Hence, the acquisition of autoradiographic sections can be achieved by digitizing the autoradiographic film, previously laid down on the surface of the scanner (Fig. 11 (a)).
The acquisition of homologous histological sections (same sections as those processed for autoradiography or adjacent sections coming from another batch) can then be achieved by directly laying down glass slides, arranged one below the other, on the surface of the scanner (Fig. 10 (b)).
 b.
b. 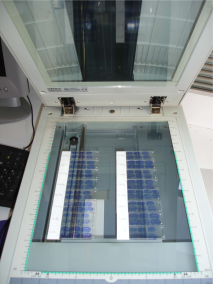
Fig. 10: (a) Acquisition of autoradiographic sections and corresponding radioactive [14C] standards. (b) Acquisition of homologous histological stained sections.
The arrangement in which the glass slides have been exposed to an autoradiographic film or laid down on the surface of the scanner (Top->Bottom or Bottom->Top) will be requested as a parameter value by process 02. image - individualizing and stacking multiple slices (Fig. 11).
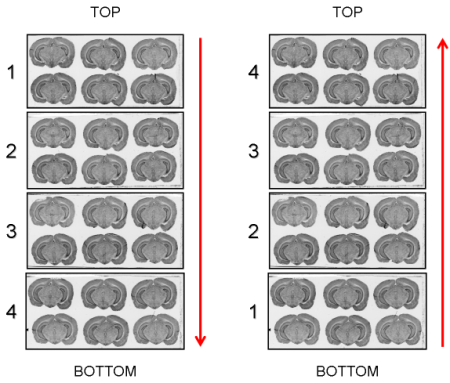
Fig. 11: Arrangement of glass slides on the surface of the scanner: Top->Bottom and Bottom->Top.
Note
- An a priori knowledge of section number and surface is used to perform iterative erosions, and thereby identify and extract the main connected components in the binary image of an overall scan. Consequently:
- There must not be objects with a similar surface in the image (e.g. handwritten section number);
- If important variations in section surface are observed from one glass slide to another, do not acquire too much glass slides together as a same overall scan;
- Changes in the original geometry of each section due to the mounting on glass slides may appear and induce the separation of some parts of the brain (olfactory bulb, occipital cortex, etc.). If necessary, a pre-processing can be required to artificially put back together these parts, using image manipulation software.
- If several batches have been obtained from adjacent sections (several stain dyes, immunohistochemistry, etc.), make sure that the sections acquired together come from the same batch.
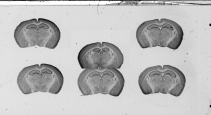
Each column of histological and autoradiographic sections as well as the standards are then independently digitized and stored in TIFF format in a database (Fig. 12 (a), (b) and (c)).
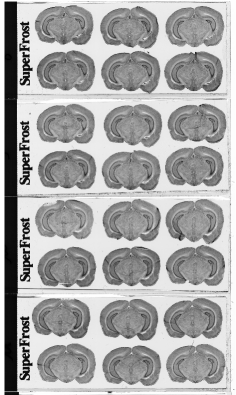 b.
b. 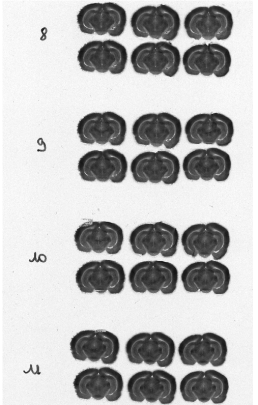 c.
c. 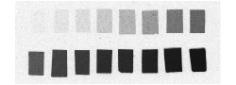
Fig. 12: (a) Overall scan of histological sections stained with cresyl violet (three glass slides arranged in a column, 600 dpi). (b) Overall scan of corresponding [14C]-2DG autoradiographic sections. (c) Radioactive [14C] standards.
Concerning our demonstration data set, we used a single 35*43 cm autoradiography film, the sections being distributed on the film as follows: 3 columns of 6 glass slides and 1 column of 7 glass slides, each one containing 6 sections, and 1 slide bearing radioactive [14C] standards within the fourth column. Hence, both [14C] standards and background were identical for all sections and consequently a single calibration was necessary.
