Note
Click here to download the full example code
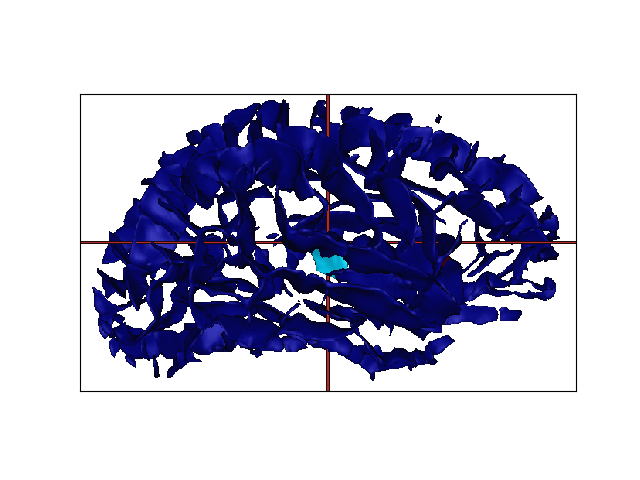
Graph manipulation
Loading and displaying a graph
from __future__ import absolute_import
import anatomist.direct.api as anatomist
from soma import aims
import sys
from soma.qt_gui import qt_backend
qt_backend.set_qt_backend(compatible_qt5=True)
from soma.qt_gui.qt_backend import QtGui
import sys

if QtGui.qApp.startingUp():
    runqt = True

g = aims.read('Rbase.arg')

a = anatomist.Anatomist()

ag = a.toAObject(g)
ag.releaseAppRef()
for x in g.vertices():
    x['toto'] = 12.3

g.vertices().list()[10]['toto'] = 24.3
g.vertices().list()[12]['toto'] = 48

ag.setColorMode(ag.PropertyMap)
ag.setColorProperty('toto')
ag.notifyObservers()

w = a.createWindow('3D')
w.addObjects(ag, add_graph_nodes=True)

w.camera(view_quaternion=[0.5, -0.5, -0.5, 0.5])
w.windowConfig(view_size=[642, 384])


if __name__ == '__main__':
    # display in matplotlib for sphinx_gallery
    if w.sphinx_gallery_snapshot():
        runqt = False
    if runqt:
        QtGui.qApp.exec_()
    if runqt or 'sphinx_gallery' in sys.modules:
        del w, x, ag, g
Total running time of the script: ( 0 minutes 4.305 seconds)
